E&E Industry Growth Drivers in Malaysia’s Export Market
Examining how semiconductor demand and global supply chain shifts are reshaping electrical and electronics production in Malaysia.
Read MoreHow Malaysia’s car manufacturing sector is adapting to electric vehicle demand, supplier network changes, and shifting global trade dynamics
Malaysia’s automotive sector isn’t just about numbers on a spreadsheet. It’s a complex web of manufacturers, suppliers, and logistics networks that’ve been building momentum for decades. The industry currently produces around 600,000 vehicles annually, making it a significant regional player in Southeast Asia.
What’s changing right now? We’re seeing a fundamental shift. Traditional combustion engines aren’t disappearing overnight, but electric vehicles are creating new demands on production lines. Suppliers who’ve specialized in certain components are now scrambling to adapt. Factory utilisation rates tell us whether manufacturers are running efficiently or if there’s idle capacity waiting to be filled.
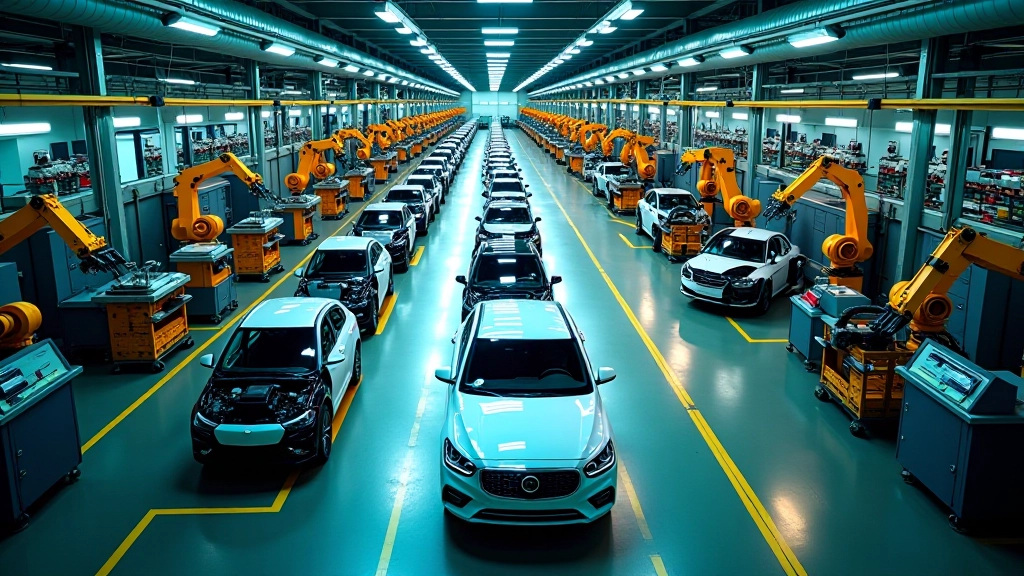
Production volumes fluctuate based on global demand, raw material costs, and semiconductor availability. In 2025, we saw output stabilize around 580,000-620,000 units monthly across Malaysia’s key manufacturing hubs. That’s not huge growth, but it’s steady. Most of this production comes from established players with long-standing relationships with international buyers.
Here’s what matters: the breakdown between domestic consumption and exports. Roughly 70% of Malaysia’s automotive output gets exported, which means the sector depends heavily on international market conditions. When trade tensions rise or shipping costs spike, manufacturers feel the pressure immediately.
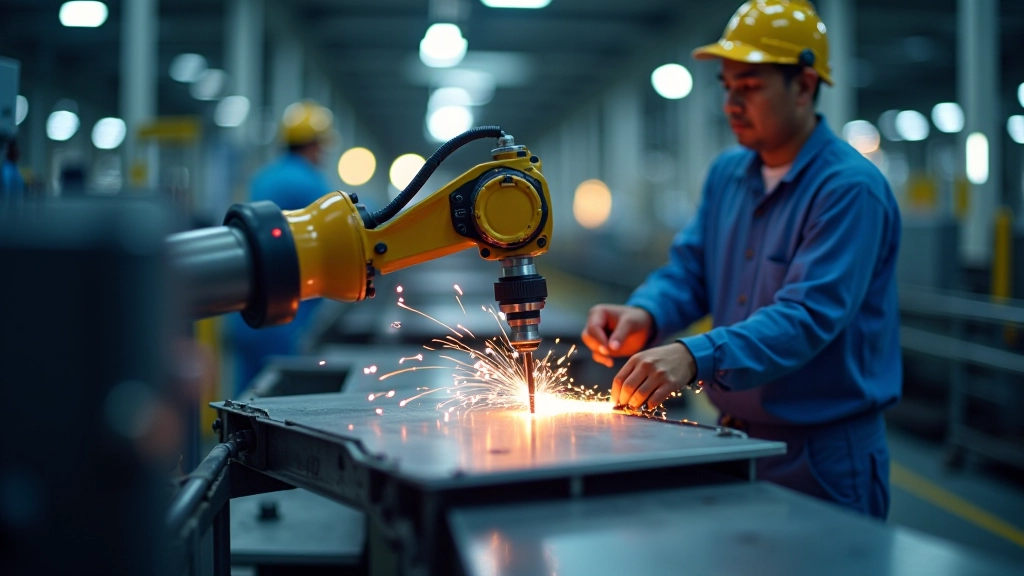
The real challenge isn’t capacity. Most plants can produce more if demand increases. The constraint is often supply chain reliability. You need consistent flows of engines, transmissions, electronics, and interior components. When suppliers struggle, production slows—even if the assembly line itself could run faster.
Malaysia’s automotive supply chain used to work pretty straightforwardly: raw materials come in, parts get manufactured, finished vehicles go out. That linear model worked fine for decades. Now? It’s way more complicated, and that’s actually a good thing.
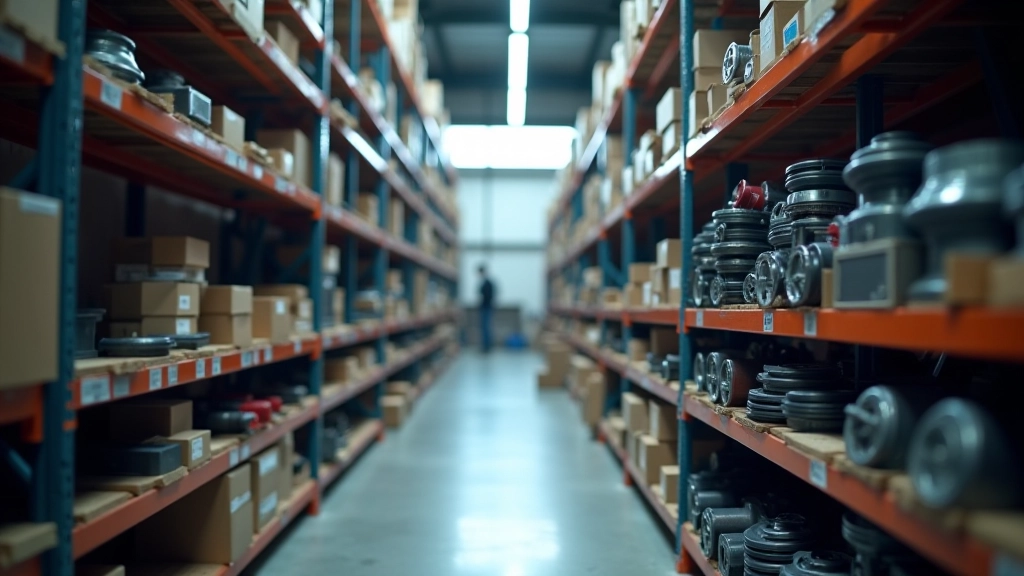
Major suppliers concentrate in specific zones—Shah Alam, Selangor, Perak. This creates efficiency through proximity but also vulnerability if regional issues occur.
Manufacturers push suppliers to deliver components on exact schedules. One delay cascades down the line. It’s efficient but leaves little room for error.
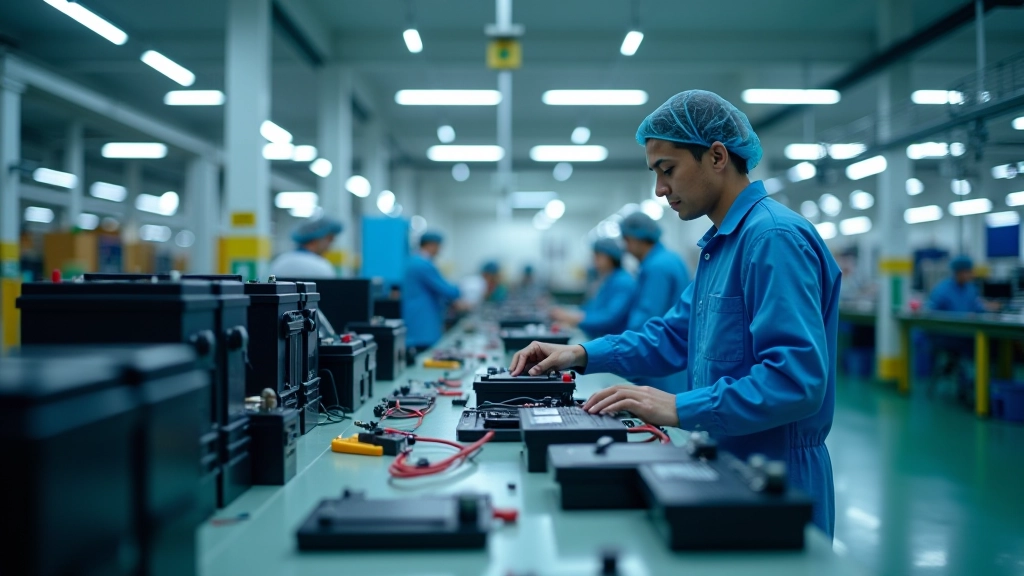
Battery packs, electric motors, and power electronics require different suppliers than traditional engines. Supply chains are splitting and reforming.
What’s emerging is a dual-track system. Traditional suppliers keep producing for combustion vehicles. Meanwhile, new suppliers are setting up to serve EV manufacturers. This creates both opportunity and disruption.
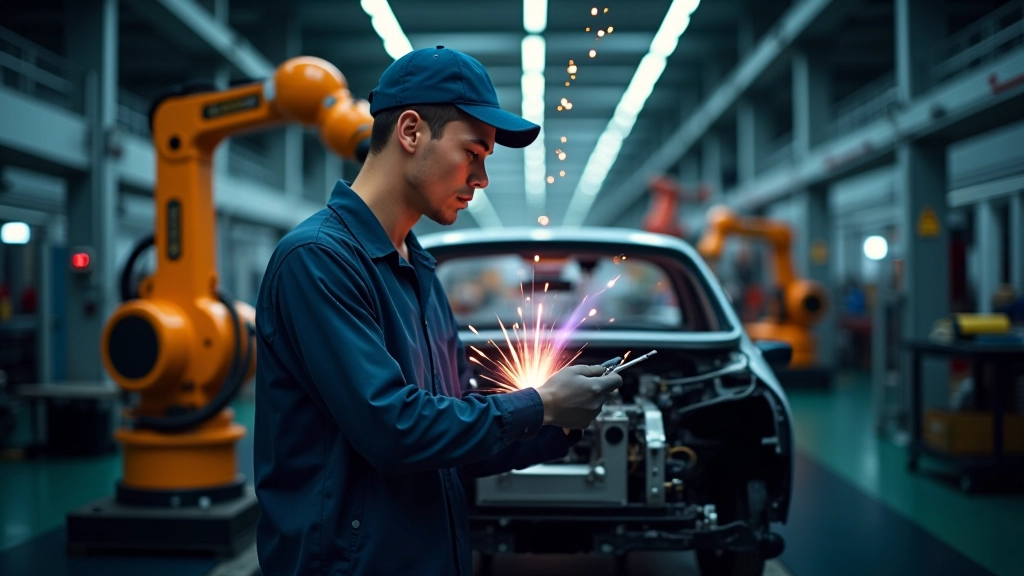
Electric vehicles aren’t just an environmental choice—they’re forcing production redesigns. An EV has roughly 20% fewer parts than a traditional car, which sounds like it’d simplify manufacturing. Instead, it’s creating completely new complexity.
Battery assembly requires different expertise and equipment. Power electronics demand precision that standard mechanical work doesn’t. Quality control processes need overhaul. Workers need retraining. Factories that’ve been optimized for 40 years of combustion engine production are essentially rebuilding their core operations.
Current Malaysian production includes electric vehicles, but they’re still a small percentage of total output. Most EVs in the region get imported. However, that’s shifting. Local manufacturers are starting pilot programs. By 2028-2030, we’ll likely see meaningful EV production from Malaysian facilities, which means supply chains are preparing now.
Factory Utilisation Rate
Current average across major facilities
Daily Production Cycles
24-hour operations at peak capacity
Available Capacity Buffer
Room for production increases
Factory utilisation rates show what percentage of available production capacity a facility actually uses. A 75% rate means the factory could theoretically produce 25% more without major investment. That buffer matters.
When utilisation drops below 70%, factories start losing money on fixed costs. When it climbs above 90%, bottlenecks appear and quality suffers. The 75-82% range Malaysia’s currently operating in? That’s the sweet spot. It’s efficient without being reckless.
What drives utilisation rates? Demand fluctuations, seasonal patterns, supply chain disruptions, and worker availability all play roles. During peak months (typically October-December), rates push toward 85%. During slower periods, they drop to 70%. Manufacturers monitor these closely because they directly impact profitability and employment levels.
Expect continued investment in EV capability while combustion vehicle production remains strong. Supply chains will parallel-track. Factory utilisation should stay stable around 75-80%.
EV production scaling up. Some traditional suppliers consolidating or specializing. Factories will need updated equipment. Workforce skills evolution continues.
Companies are diversifying supplier bases after recent disruptions. Local sourcing increasing. Regional partnerships strengthening to reduce dependency on distant suppliers.
Malaysia’s positioning as a quality automotive hub strengthens. Lower production costs than developed nations, reliable infrastructure, skilled workforce—that’s still attractive to global manufacturers.
The sector’s not in crisis. It’s evolving. Production will continue, supply chains will adapt, factories will modernize. The companies that invest in flexibility now—those willing to retrain workers, update equipment, and build relationships with new suppliers—they’re the ones who’ll thrive through this transition.
This article presents analysis based on available industry data and trends as of March 2026. Production figures, utilisation rates, and projections reflect general patterns in Malaysia’s automotive sector. Specific facility data varies by manufacturer and changes regularly. For detailed information about individual companies, specific production timelines, or investment decisions, we recommend consulting directly with industry participants or official trade associations. This content is educational and informational—not predictive of future outcomes or financial advice.